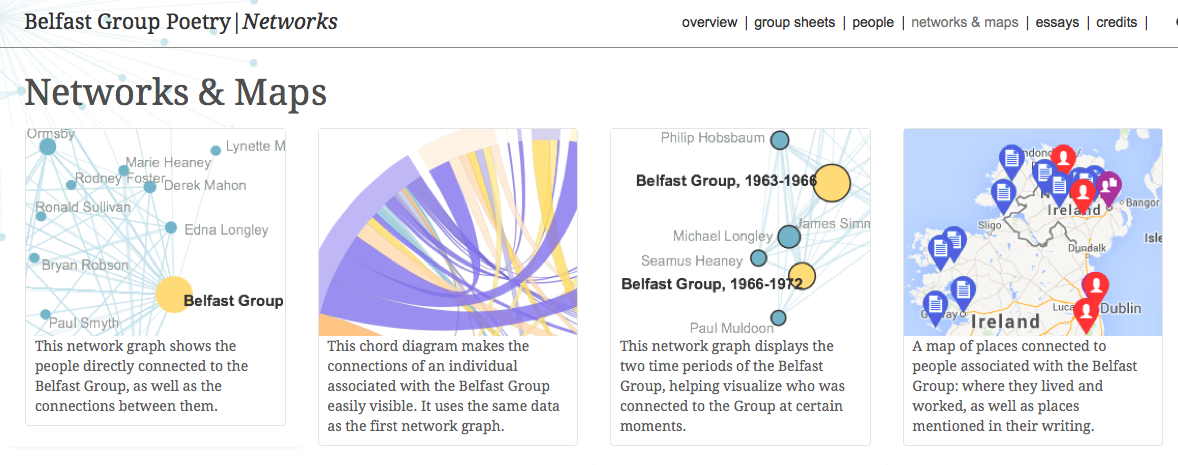
Categories
Mapping Visualization

Torn Apart / Separados

Torn Apart is part of our Mobilized Humanities interventions. MH brings together digital tools to equip broad social awareness and help in global critical situations. We mobilize humanities faculties, libraries, and students with relevant language, archival, technical, and social expertise to nimbly produce curated and applied knowledge. MH sits away from state and non-governmental organizations and is scholarly activism in a global context.” The project currently has two volumes, each of which present multiple visualizations of data related to the current immigration crises in the United States.

Visualization from Volume 1 of Torn Apart

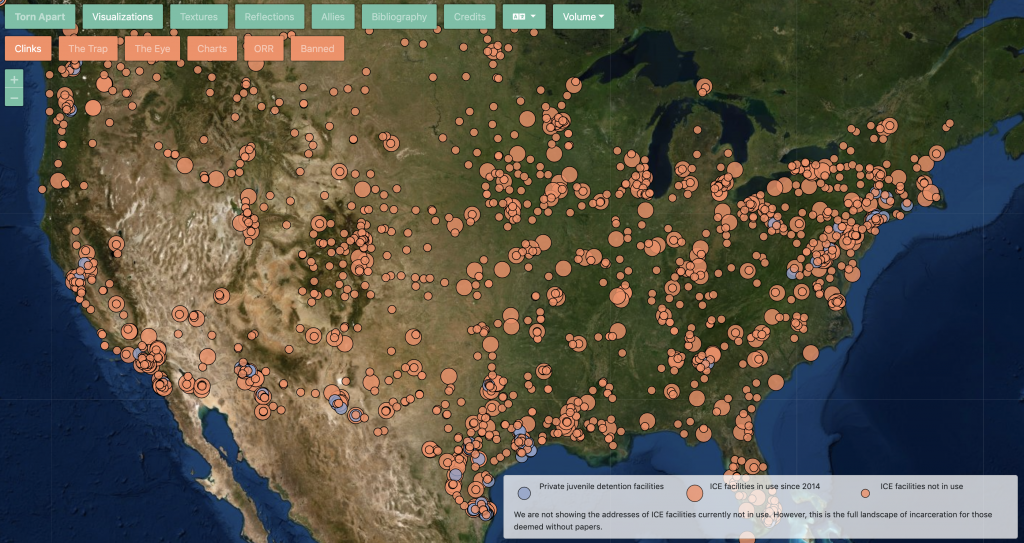
Volume 1 of Torn Apart is “a rapidly deployed critical data & visualization intervention in the USA’s 2018 “Zero Tolerance Policy” for asylum seekers at the US Ports of Entry and the humanitarian crisis that has followed.”

Visualization from Volume 2 of Torn Apart

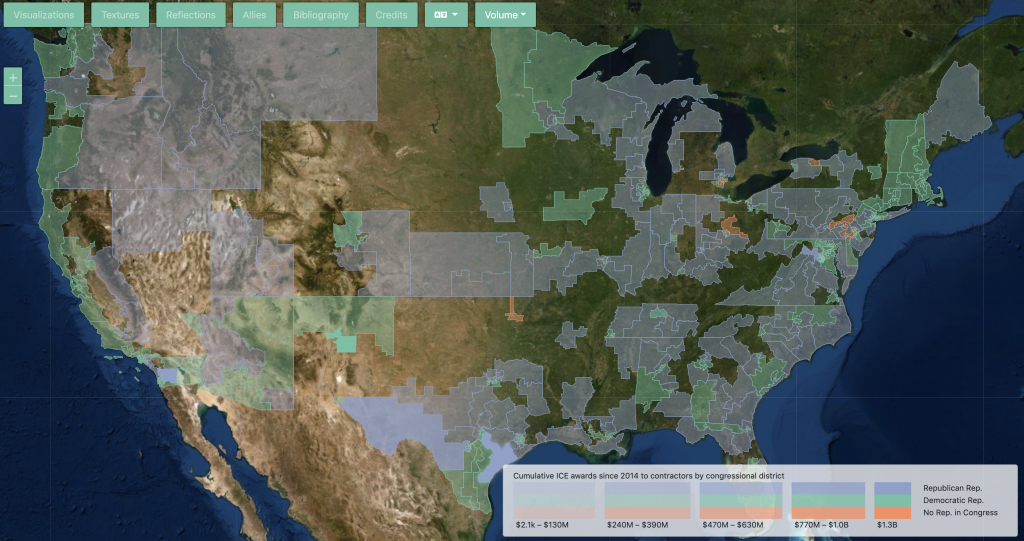
Volume 2 of Torn Apart examines the territory and infrastructure of ICE’s financial regime in the USA. 

Categories
Crowdsourcing Mapping Visualization

Queering the Map

Each point on the map represents a location of queer experience.

Queering the Map is a community-generated mapping project that geo-locates queer moments, memories and histories in relation to physical space. As queer life becomes increasingly less centered around specific neighborhoods and the buildings within them, notions of ‘queer spaces’ become more abstract and less tied to concrete geographical locations. The intent of the Queering the Map project is to collectively document the spaces that hold queer memory, from park benches to parking garages, to mark moments of queerness wherever they occur.” The project was developed by Lucas LaRochelle, a design student at Concordia University in Montreal.

Categories
Archive Mapping Visualization

Enslaved Peoples Projects

Enslaved peoples in Central Pennsylvania, circa 1800
Screenshot from the video
The Forced Migration of Enslaved People site combines data visualization with excerpts from slave narratives.

Categories
Audio analysis Textual analysis Visualization

Poemage

Screen Shot 2016-08-08 at 5.48.53 PM

Categories
Mapping Network Analysis Visualization

Belfast Group Poetry

After the Belfast Group stopped meeting in 1972, many participants downplayed its importance to the development of their writing. Regardless of its ultimate impact, the writing workshop nevertheless connected many authors in Northern Ireland. The pages linked above visualize these networks of relationships, as well as the writers’ connections to specific places.Screen Shot 2016-08-08 at 5.29.25 PM