Native Land visualizes the territories and languages of native peoples (primarily in North America and Australia), and the treaties which affected those people. Users can search by location to discover on what native lands that location resides, what languages were spoken, and what treaties impacted the native people living there.
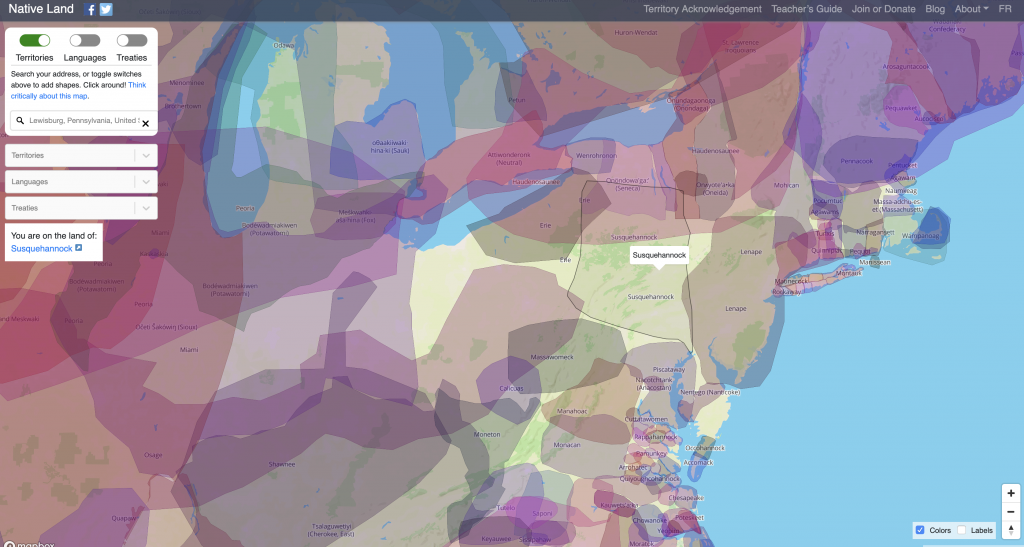
Native Land was created in 2015 by Victor Temprano, a settler hailing from Okanagan territory in Canada. As of 2018, Native Land Digital is a Canadian not-for-profit organization, and is designed to be Indigenous-led, with an Indigenous Board of Directors who oversee and direct the organization.
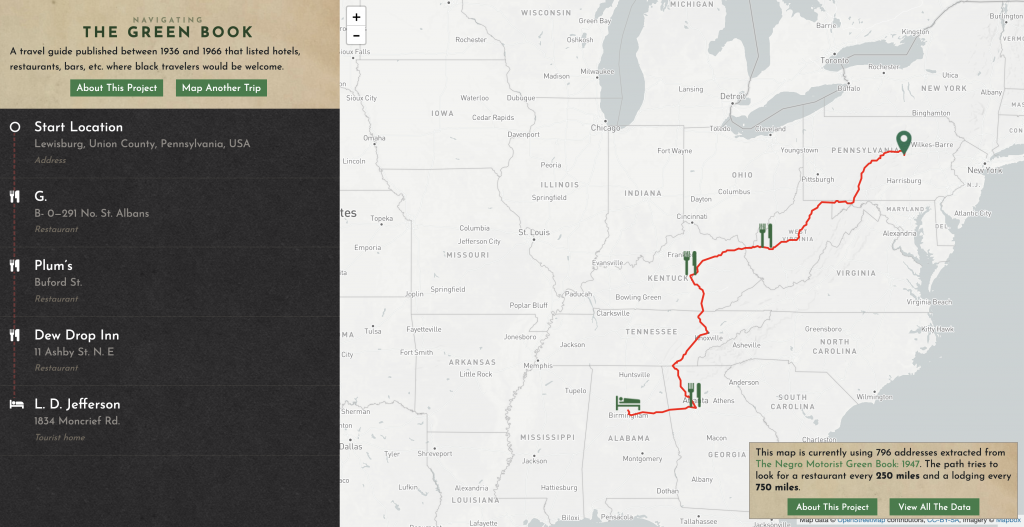
The Green Book was a travel guide published between 1936 and 1966 that listed hotels, restaurants, bars, gas stations, etc., where black travelers would be welcome. Developers at the New York Public Library have extracted data from the 1947 and 1956 editions of the Green Book and developed the Navigating the Green Book interface through which users can explore and visualize the data.
“The Lesbian and Gay Liberation in Canada (LGLC) project brings together accounts of over 34,000 events, people, and places that shaped the creation of gay political consciousness in Canada, spanning from the formation of the first homophile group in in 1964 to the start of the AIDS crisis in 1981. The project takes two books, Don McLeod’s chronologies Lesbian and Gay Liberation in Canada Volumes 1 and 2, and has converted them into a database that allows users to explore the people, places, events, and publications that defined Canadian lesbian and gay liberation history.”

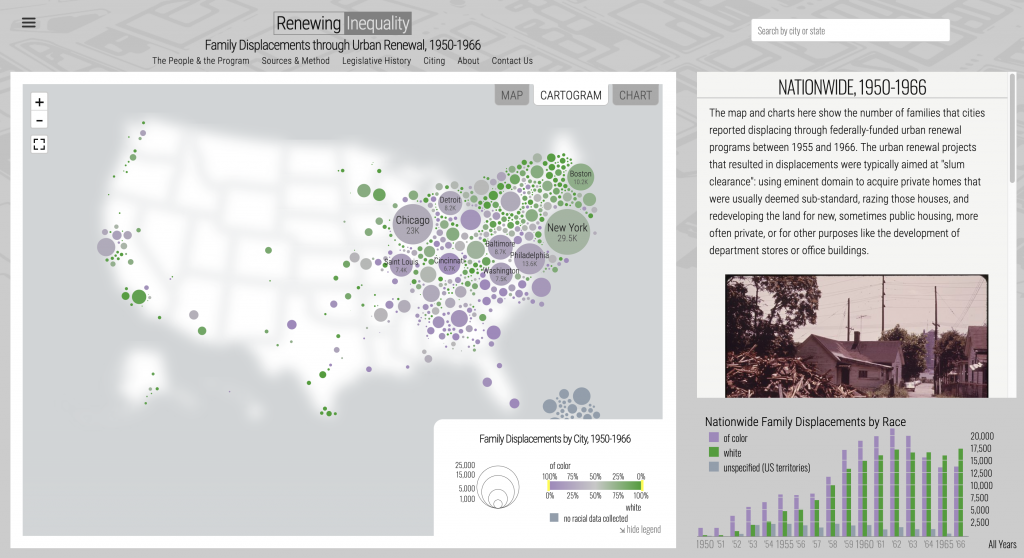
American Panorama is an historical atlas of the United States which combines cutting-edge research with interactive mapping techniques. Hosted by the University of Richmond, American Panorama includes several projects which examine United States history through a critical lens and foreground the lasting impacts of racially-based policies. Mapping Inequality: Redlining in New Deal America visualizes hundreds of Home Owners’ Loan Corporation maps created between 1935 and 1940, and reveals the ways in which cities were “graded” for potential home buyers along racial lines. Renewing Inequality: Family Displacements through Urban Renewal, 1950-1966 visualizes the impact of federal government government programs that provided funding for cities large and small to raze “blighted” or “slum” neighborhoods.